Rescuing a medical treatment from failure in a clinical trial by using  Post Hoc Bayesian Analysis 

How can researchers maximize learning from experiments, especially from very expensive experiments such as clinical trials? This article shows how a Bayesian analysis of the data would have been much more informative, and likely would have saved a useful new technique for dealing with ARDS.

I am a big supporter of Bayesian methods, which will become even more important/useful with machine learning. But a colleague, Dr. Nick Eubank, pointed out that the data could also have been re-analyzed using frequentist statistics. The problem with the original analysis was not primarily that they used frequentist statistics. Rather, it was that they set a fixed (and rather large) threshold for defining success. This threshold was probably unattainable. But the clinical trial could still have been “saved,” even by conventional statistics.

Source: Extracorporeal Membrane Oxygenation for Severe Acute Respiratory Distress Syndrome and Posterior Probability of Mortality Benefit in a Post Hoc Bayesian Analysis of a Randomized Clinical Trial. | Critical Care Medicine | JAMA | JAMA Network

Here is a draft of a letter to the editor on this subject. Apologies for the very academic tone – that’s what we do for academic journals!

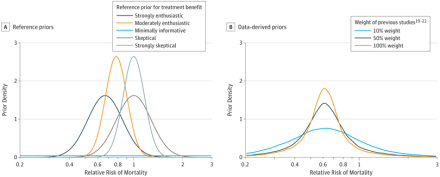
The study analyzed in their article was shut down prematurely due to the unlikelihood that it would attain the target level of performance. Their paper shows that this might have been avoided, and the technique shown to have benefit, if their analysis had been performed before terminating the trial. A related analysis could usefully have been done within the frequentist statistical framework. According to their Table 2, a frequentist analysis (equivalent to an uninformative prior) would have suggested a 96% chance that the treatment was beneficial, and an 85% chance that it had RR < .9 .

The reason the original study appeared to be failing was not solely that it was analyzed with frequentist methods. It also failed because the target threshold for “success” was set at a high threshold, namely RR < .67. Thus, although the full Bayesian analysis of the article was more informative, even frequentist statistics can be useful to investigate the implications of different definitions of success.

Credit for this observation goes to Nick. I will ask him for permission to include one of his emails to me on this subject.

Showing linear regression coefficients

I have just finished my Big Data course for 2017, and noted some concepts that I want to teach better next year. One of them is how to interpret and use the coefficient estimates from linear regression. All economists are familiar with dense tables of coefficients and standard errors, but they require experience to read, and are not at all intuitive. Here is a more intuitive and useful way to display the same information. The blue dots show the coefficient estimates, while the lines show +/- 2 standard errors on the coefficients. It’s easy to see that the first two coefficients are “statistically significant at the 5% level”, the third one is not, and so on. More important, the figure gives a clear view

Coef plot from strengejacke Bof the relative importance of different variables in determining the final outcomes.

The heavy lifting for this plot is done by the function sjp.lm from the sjPlot library. The main argument linreg is the standard results of a linear regression model, which is a complex list with all kinds of information buried in it.  Continue reading

Econometrics versus statistical analysis

I teach a course on Data Mining, called Big Data Analytics. (See here for the course web site.) As I began to learn its culture and methods, clear differences from econometrics showed up. Since my students are well trained in standard econometrics, the distinctions are important to help guide them.

One important difference, at least where I teach, is that econometrics formulates statistical problems as hypothesis tests. Students do not learn other tools, and therefore they have trouble  recognizing problems where hypothesis tests are not the right approach.  Example: when viewing satellite images, distinguish urban from non-urban areas. This cannot be solved well in a hypothesis testing framework.

Another difference is less fundamental, but also important in practice: using out-of-sample methods to validate and test estimators is a religious practice in data mining, but is almost not taught in standard econometrics. (Again, I’m sure PhD courses at UCSD are an exception, but it is still rare to see economics papers that use out of sample tests.) Of course in theory econometrics formulas give good error bounds on fitted equations (I still remember the matrix formulas that Jerry Hausman and others drilled into us in the first year of grad school). But the theory assumes  that there are no omitted variables and no measurement errors! Of course all real models have many omitted variables. Doubly so since “omitted” variable includes all  nonlinear transforms of included variables.

Here are two recent columns on other differences between economists’ and statisticians’ approaches to problem solving.

I am not an econometrician  by Rob Hyndman.

and

Differences between econometrics and statistics: From varying treatment effects to utilities, economists seem to like models that are fixed in stone, while statisticians tend to be more comfortable with variation, by Andrew Gelman.

Self-driving cars may take decades to prove safety: Not so.

Proving self-driving cars are safe could take up to hundreds of years under the current testing regime, a new Rand Corporation study claims. Source: Self-driving cars may not be proven safe for decades: report  The statistical analysis in this paper looks fine, but the problem is even worse for aircraft (since they are far safer per mile than autos.) Yet new aircraft are sold after approx 3 years of testing, and less than 1 million miles flown. How?

From the report:

we will show that fully autonomous vehicles would have to be driven hundreds of millions of miles and sometimes hundreds of billions of miles to demonstrate their reliability in terms of fatalities and injuries. Under even aggressive testing assumptions, existing  fleets would take tens and sometimes hundreds of years to drive these miles.

How does the airline industry get around the analogous statistics? By understanding how aircraft fail, and designing/testing for those specific issues, with carefully calculated specification limits. They don’t just fly around, waiting for the autopilot to fail!

Continue reading

Climate promises are easy to make, but hard to keep

My upcoming BGGE course will have some major projects on climate change negotiation, so I’ve been reading about recent developments more than usual. As usual,  Bjørn Lomborg has some intriguing ways of slicing the numbers. Unlike the old days, GCC deniers won’t get much comfort from him, though.

To be sure, Europe has made some progress towards reducing its carbon-dioxide emissions. But, of the 15 European Union countries represented at the Kyoto summit, 10 have still not meet the targets agreed there. Neither will Japan or Canada. And the United States never even ratified the agreement. In all, we are likely to achieve barely 5% of the promised Kyoto reduction.

To put it another way, let’s say we index 1990 global emissions at 100. If there were no Kyoto at all, the 2010 level would have been 142.7. With full Kyoto implementation, it would have been 133. In fact, the actual outcome of Kyoto is likely to be a 2010 level of 142.2 – virtually the same as if we had done nothing at all. Given 12 years of continuous talks and praise for Kyoto, this is not much of an accomplishment.

The Kyoto Protocol did not fail because any one nation let the rest of the world down. It failed because making quick, drastic cuts in carbon emissions is extremely expensive. Whether or not Copenhagen is declared a political victory, that inescapable fact of economic life will once again prevail – and grand promises will once again go unfulfilled.

via Project Syndicate – Climate Change and “Climategate”.

How to lie with statistics – example 322

Paul Kedrosky reproduces some data on supposedly  fast growth industries:

According to a new study, here are the best and worst performing industries of the last decade as measured in revenue percentage change terms. Here are the leaders:

Some of these are doubtless valid, but the top 4 are all industries that had virtually no revenue at all in the 1990s, since they basically did not exist were not measured until Internet companies started to go public.  It’s easy to have an astronomical growth rate if you make the base number small enough. Startups do this a lot – “our revenue grew 1500% in our first 2 years.” That could mean they had $1000 of revenue in year 1, and $15000 in year 3!