For much of the Covid-19 pandemic, the USA was the worst off by many measures. Total number of cases, number of deaths, incidence rate (new cases per capita) — we were the highest large country on all of them.
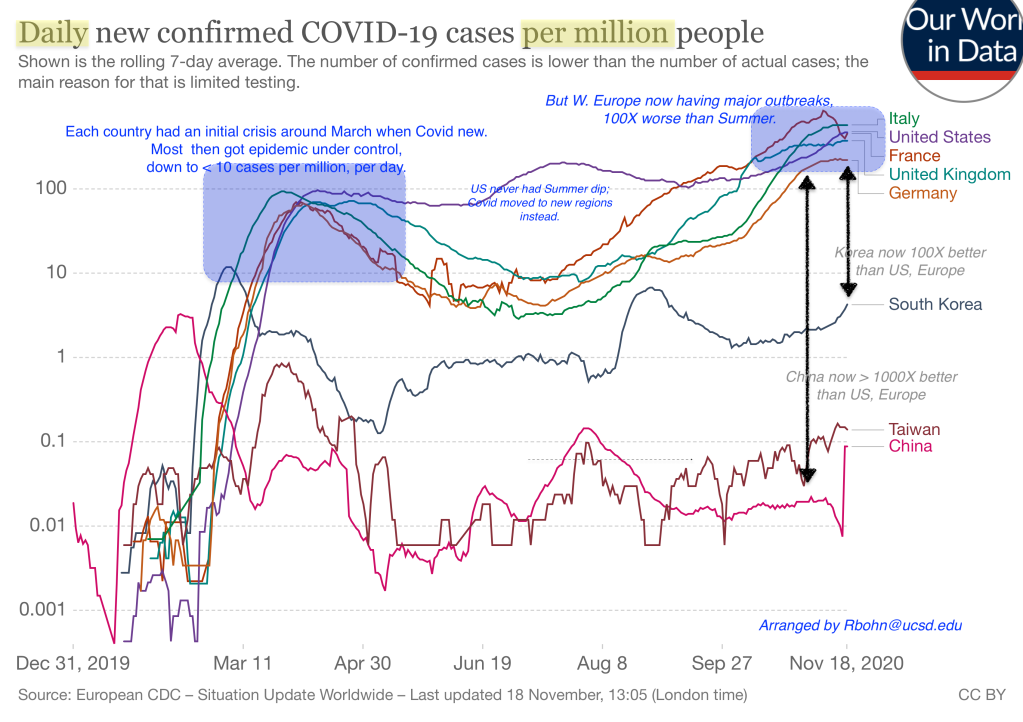
That is no longer true, to my surprise. Much of Europe is now as badly off as we are. The relevant comparison is per capita, in order to adjust for country size. I selected 4 large European countries: Italy, France, UK, and Germany. Three are now in the same range of misery, although Germany has been consistently a bit better. This figure shows daily incidence. (New cases per day.)

Historical trajectory: All 4 of these European countries were comparable to the U.S. in March, but that is somewhat misleading. The US had much higher incidence in a few places, notably New York City, but very low in most of the country. Then the European countries, like NYC, got the virus suppressed successfully during the Summer, as shown by the dips around July. But in the US Covid then spread from state to state, so that averaging over our entire continent-sized country, incidence got worse, not better.
Now as Winter arrives, Europe and the US are both doing very badly. Italy, the U.K., and France have all had the highest incidence at some point, but the US is still getting worse, while the other countries seem to be leveling off. Meanwhile Germany has been consistently bad, but not as bad as the others in Europe + the US. All 5 countries are having hundreds of new cases per million population, per day. 300 cases per million per day works out to 11 percent of the population over a year.
(Smaller European countries are not shown, and have variations on these patterns.)
But look at Korea and China: The other big pattern here is how good China has been, once it crushed the initial Wuhan-area outbreak. By March it was down to .1 new cases per million per day, and with one minor exception never went above that rate up to the present. Korea, meanwhile, has been midway between China and Europe. Taiwan has been in the same range as China, although since Taiwan is both small and an island it has an easier control problem. (See New Zealand and Singapore for other examples.)
The huge differences among China, Korea, and Europe are shown by the thick black vertical arrows in November. If we want to speculate about why the 3 Asian countries are so much better, we could mutter about “cultural attitudes toward following rules.” We can point out that all 3 countries have long traditions of wearing cloth face masks when illness is around. Still another ex-post rationale is that in 2003 these countries went through frightening experiences with SARS (SARS-CoV-1, while Covid-19 virus is SARS-CoV-2). SARS might have exploded the way its cousin has done, but hard work by many countries controlled it before that happened. In Asia, at least, they did not forget the lessons learned at that time.
Change the display: What does this look like on a linear scale, instead of a log? Very different, even though the numbers are identical. (See below.) Korea, China, and Taiwan are all down at the bottom of the figure, hard to distinguish from zero. The Winter crisis we are now entering looks much more dangerous than any previous period, for all five non-Asian countries. Finally, Korea now looks like the other 2 Asian countries, while Germany looks halfway between best and worst.
